📌 수직 막대 그래프 그리기
bar ( x , height, width, color, edgecolor, linewidth, label )
- x : x 축 값
- height : y축 값
- width : 막대 그래프 너비
- color : 막대 그래프 색상
- edgecolor : 막대 테두리 색상
- linewidth : 막대 테두리 선 굵기
- label : 범례 표기 내용
# matplotlib 임포트
import matplotlib.pyplot as plt

# 그래프 그릴 데이터 생성
fruit = ['apple', 'grape', 'lemon', 'mango']
quantity = [ 100, 300, 250, 180]

# 그래프 생성
plt.figure(figsize=(10,8)) #그래프 그릴 영역 생성
plt.bar(
    x = fruit,
    height = quantity,
    width = 0.8,
    color = 'lightgreen',
    edgecolor = 'black',
    linewidth = 0.8,
    label = 'quantity') #수직 막대 그래프 그리기
plt.xlabel('fruit') # x축 이름 표기
plt.legend() #범례 표기
plt.show()

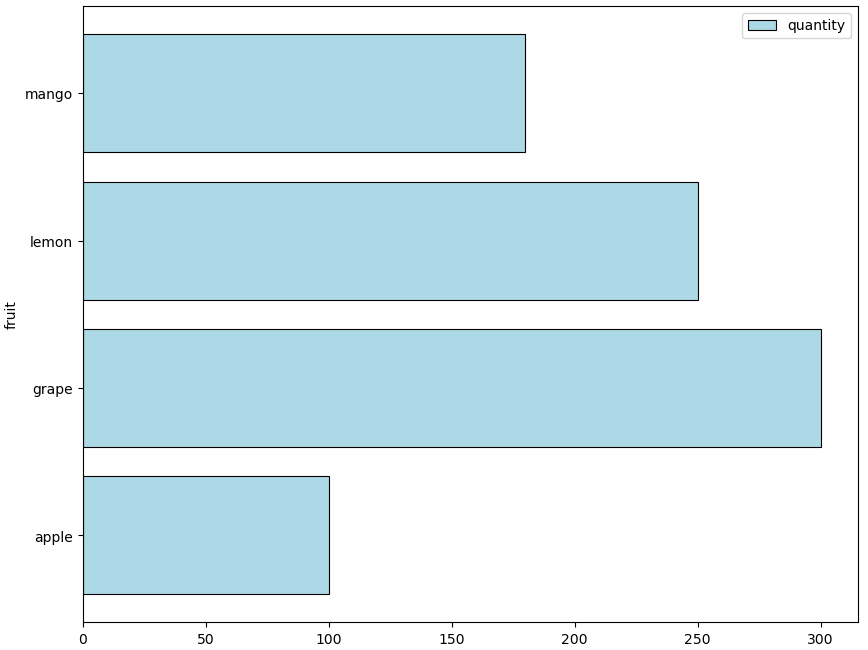
📌 수평 막대 그래프 그리기
barh ( y , width, height, color, edgecolor, linewidth, label )
- y : y 축 값
- width : x축 값
- height : 막대 그래프 너비
- color : 막대 그래프 색상
- edgecolor : 막대 테두리 색상
- linewidth : 막대 테두리 선 굵기
- label : 범례 표기 내용
# matplotlib 임포트
import matplotlib.pyplot as plt

# 그래프 그릴 데이터 생성
fruit = ['apple', 'grape', 'lemon', 'mango']
quantity = [ 100, 300, 250, 180]

# 그래프 생성
plt.figure(figsize=(10,8)) #그래프 그릴 영역 생성
plt.barh(y = fruit,
    width = quantity,
    height = 0.8,
    color = 'lightblue',
    edgecolor = 'black',
    linewidth = 0.8,
    label = 'quantity') #수평 막대 그래프 그리기
plt.ylabel('fruit') # y축 이름 표기
plt.legend() #범례 표기
plt.show()